Comprehensive Data Management Features
Mirenox provides tools for organizing, visualizing, and analyzing all types of agricultural data relevant to Japanese farming operations.
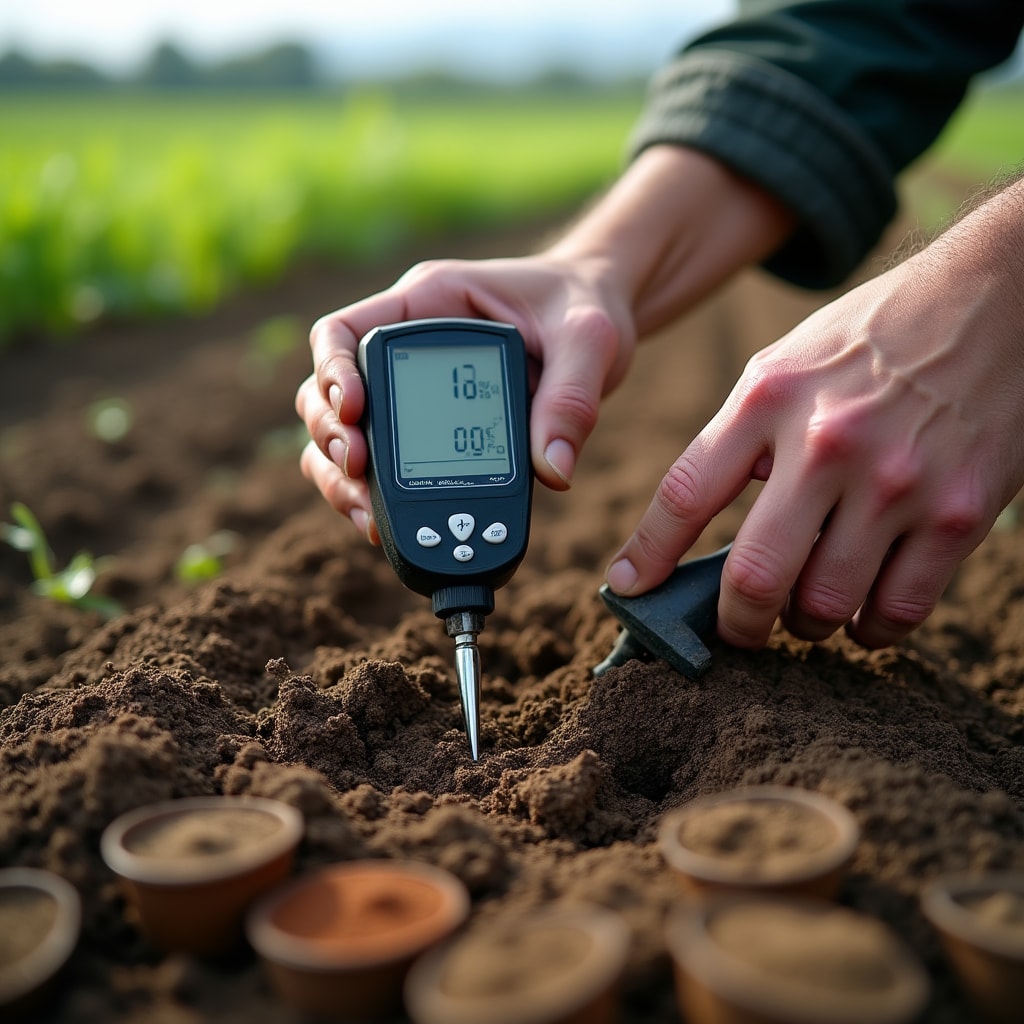
Soil Data Management
Track and analyze soil conditions across your entire property with detailed measurement organization.
Comprehensive Soil Tracking
Record soil test results including pH levels, nitrogen content, phosphorus levels, potassium measurements, and organic matter percentages. The system organizes data by field location and depth, allowing you to understand soil composition throughout your property.
Track moisture levels and drainage patterns to identify areas that may need irrigation adjustments or drainage improvements. Historical soil data helps you understand how conditions change with different crop rotations and soil amendments.
Compare soil conditions between different field sections to identify which areas produce consistent results and which might benefit from targeted interventions. The platform maintains records of soil amendments applied, making it easier to track the effects of different treatment approaches.
Weather Data Integration
Connect local weather information with your farming calendar and field observations.
Temperature Monitoring
- Daily high and low temperatures
- Growing degree day calculations
- Frost risk assessments
- Heat stress indicators
- Seasonal temperature trends
Precipitation Tracking
- Daily rainfall measurements
- Cumulative seasonal totals
- Drought condition monitoring
- Heavy rain event recording
- Irrigation planning support
Environmental Conditions
- Humidity level tracking
- Wind speed and direction
- Solar radiation data
- Evapotranspiration rates
- Forecast integration

Yield Analysis System
Maintain detailed records of crop performance across multiple growing seasons. Record harvest quantities by field section, noting the date, crop variety, and quality assessments for each harvest event.
The platform helps you identify patterns in yield performance. Compare results between different field areas to understand which locations consistently produce higher yields. Track how weather conditions during the growing season correlate with final harvest outcomes.
Document quality factors such as size distribution, appearance, and any issues encountered. This information becomes valuable when planning future plantings and evaluating which varieties perform reliably under your specific conditions.
Generate season summaries that show total production, average yields per area, and how current season performance compares with previous years. These records support informed decisions about crop selection and resource allocation.
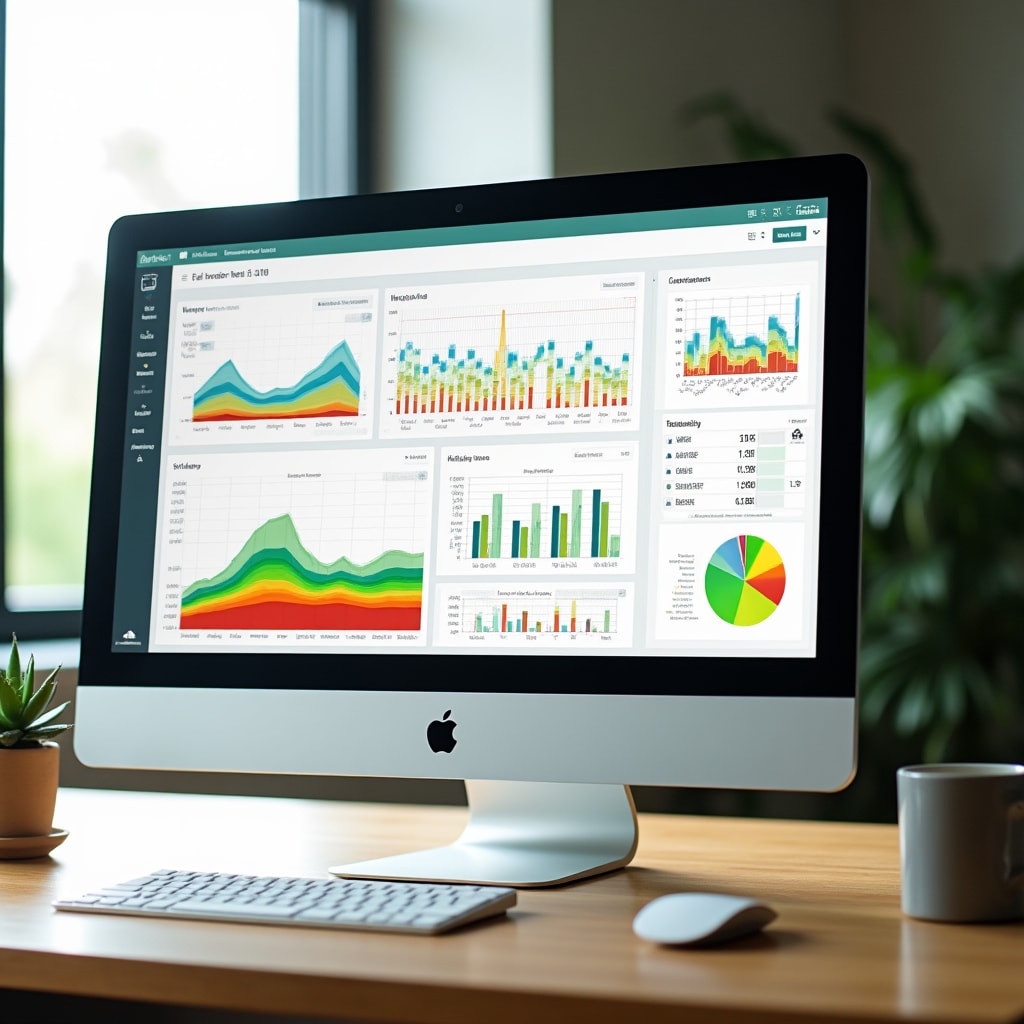
Visualization and Reporting
Transform raw data into clear visual representations that make patterns and trends immediately apparent.
Timeline Charts
View how conditions change over time with line graphs showing temperature trends, rainfall patterns, or soil moisture levels across days, weeks, or entire growing seasons.
Field Mapping
Visualize data geographically with color-coded field maps showing soil test results, yield variations, or other measurements across different areas of your property.
Data Tables
Access detailed numerical data in organized tables that can be sorted and filtered by date, location, measurement type, or any other relevant criteria.
Report Generation
Create formatted reports combining charts, maps, and tables for record-keeping, analysis, or sharing with agricultural advisors and consultants.
Data Input Options
Multiple methods for getting information into the system, accommodating different workflows and data sources.
Manual Entry
Input observations and measurements directly through the web interface or mobile application. Forms are organized by data type for quick entry during field work.
Sensor Integration
Connect compatible soil sensors, weather stations, and monitoring equipment to automatically transfer readings into the platform at scheduled intervals.
File Import
Upload data from spreadsheets or other agricultural software. The system processes common file formats and maps data fields to appropriate categories.
Photo Documentation
Attach photos to data entries to provide visual context for measurements and observations. Images are organized with their associated data records.
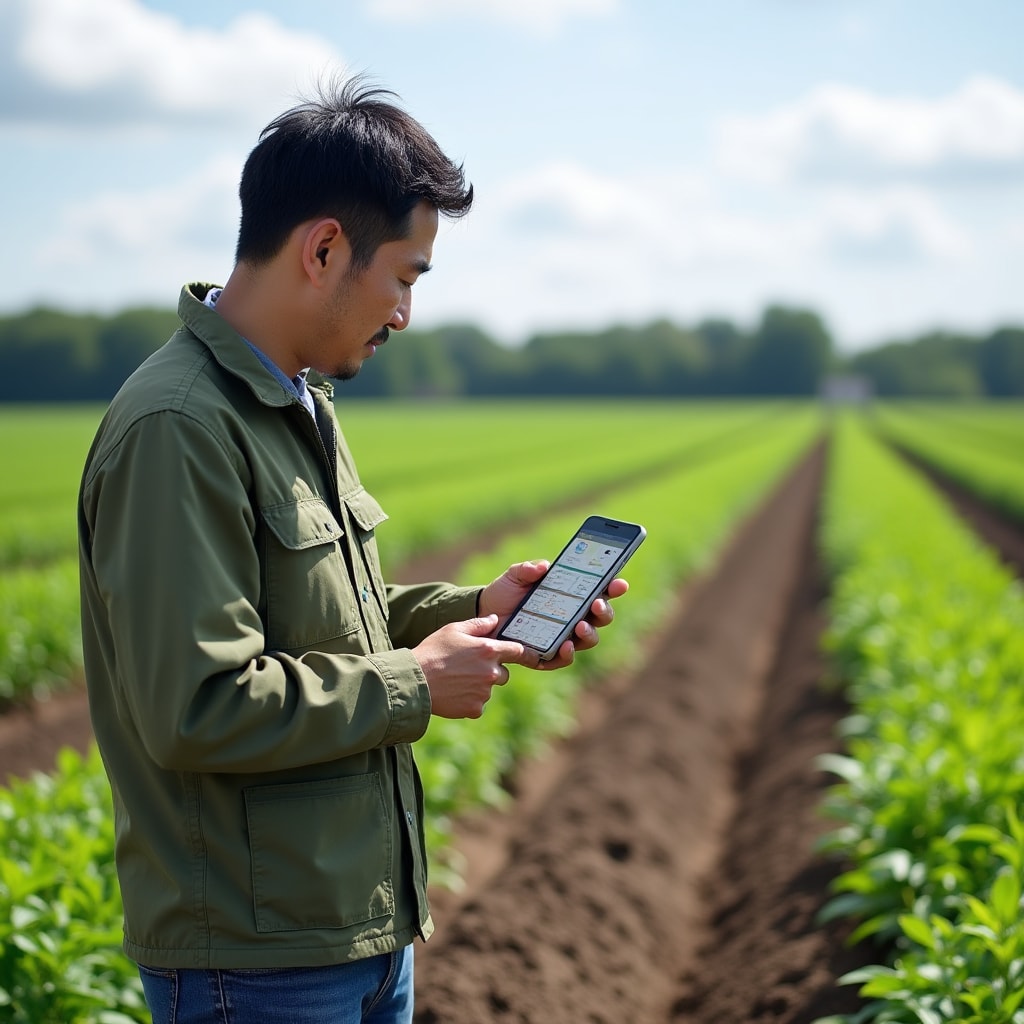
Mobile Access
Access your farm data from smartphones and tablets while working in the field. The mobile interface provides the same data organization and visualization features as the desktop version, optimized for smaller screens and touch interaction.
Add new observations or measurements immediately while inspecting fields, without needing to return to an office or remember details for later entry. Check historical data on location to compare current conditions with previous records.
The mobile application works with standard internet connections and includes offline capabilities for areas with limited connectivity. Data entered while offline syncs automatically when connection is restored.
See How These Features Work
Contact us to discuss your specific data management needs and learn how Mirenox features can support your farming operations.
We'll answer your questions about features